Find goroutine leak via pprof
The following is an example of finding goroutine leaks via pprof. pprof visualize and analyze the goroutine profile that reports the stack traces of all current goroutines. It examines the issue from different points of views.
main.go is a http server containing goroutine leak.
Each time logHandler handles the request, there’s a probability
that timeout comes earlier than when the db operation is finished. In this case,
the handler goroutine exit whereas db operation goroutine blocks for ever
(because the channel send operation blocks for ever).
We’ll use hey to simulate http loads.
  1 package main
  2
  3 import (
  4         "encoding/json"
  5         "math/rand"
  6         "net/http"
  7         _ "net/http/pprof"
  8         "time"
  9 )
 10
 11 func main() {
 12         http.HandleFunc("/log", logHandler)
 13         http.ListenAndServe(":6060", nil)
 14 }
 15
 16 func logHandler(w http.ResponseWriter, r *http.Request) {
 17         ch := make(chan int)
 18         go func() {
 19                 obj := struct {
 20                         user string
 21                         age  int
 22                 }{}
 23                 if err := json.NewDecoder(r.Body).Decode(&obj); err != nil {
 24                         ch <- http.StatusBadRequest
 25                         return
 26                 }
 27                 // simulation of a time consuming process like writing logs into db
 28                 time.Sleep(time.Duration(rand.Intn(400)) * time.Millisecond)
 29                 ch <- http.StatusOK
 30         }()
 31
 32         select {
 33         case status := <-ch:
 34                 w.WriteHeader(status)
 35         case <-time.After(200 * time.Millisecond):
 36                 w.WriteHeader(http.StatusRequestTimeout)
 37         }
 38 }
# simulate http load
> hey -d "{\"user\":\"Jack\", \"age\":17}" http://localhost:6060/log
...
...
Status code distribution:
  [200] 110 responses
  [408] 90 responses        <----------- 90 responses with "408 Request Timeout"
We will profile the run-time application and check if there’s any goroutine leaks.
# generate goroutine profile
> curl -o goroutine.pb.gz http://localhost:6060/debug/pprof/goroutine
% Total % Received % Xferd Average Speed Time Time Time Current
Dload Upload Total Spent Left Speed
100 1366 100 1366 0 0 40456 0 --:--:-- --:--:-- --:--:-- 41393
# interactive mode
> go tool pprof main.exe goroutine.pb.gz
File: main.exe
Type: goroutine
Time: Mar 4, 2023 at 11:20pm (CST)
Entering interactive mode (type "help" for commands, "o" for options)
(pprof) top
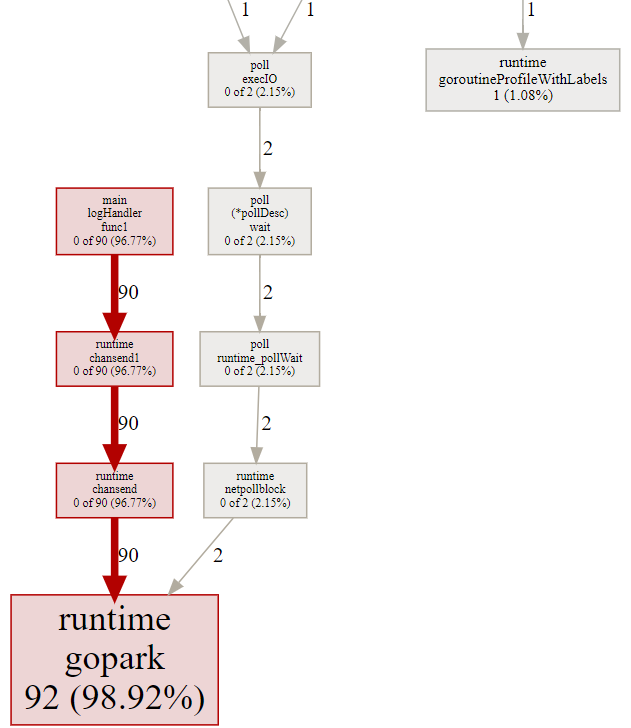
Showing nodes accounting for 93, 100% of 93 total <----- too many running goroutines
Showing top 10 nodes out of 33
flat flat% sum% cum cum%
92 98.92% 98.92% 92 98.92% runtime.gopark
1 1.08% 100% 1 1.08% runtime.goroutineProfileWithLabels
0 0% 100% 1 1.08% internal/poll.(*FD).Accept
0 0% 100% 1 1.08% internal/poll.(*FD).Read
0 0% 100% 1 1.08% internal/poll.(*FD).acceptOne
0 0% 100% 2 2.15% internal/poll.(*pollDesc).wait
0 0% 100% 2 2.15% internal/poll.execIO
0 0% 100% 2 2.15% internal/poll.runtime_pollWait
0 0% 100% 90 96.77% main.logHandler.func1 <----- 90 goroutines unexpected -- leaks
0 0% 100% 1 1.08% main.main
(pprof) q
# get an interactive web interface
> go tool pprof -http localhost:6061 goroutine.pb.gz
Serving web UI on http://localhost:6061
# visit http://localhost:6061/ui/peek
# result:
Type: goroutine
Time: Mar 4, 2023 at 11:20pm (CST)
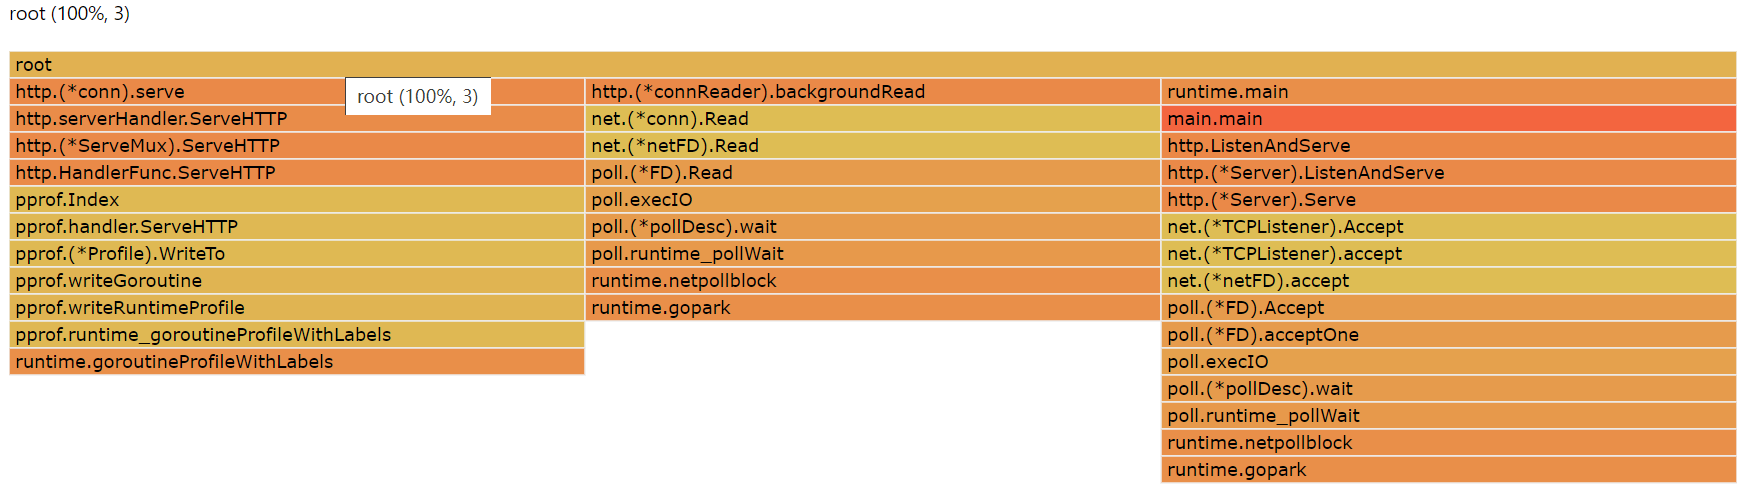
Showing nodes accounting for 93, 100% of 93 total
----------------------------------------------------------+-------------
flat flat% sum% cum cum% calls calls% + context
----------------------------------------------------------+-------------
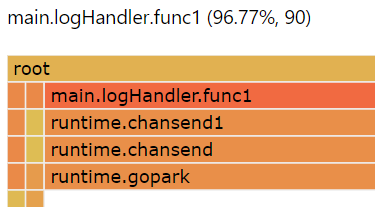
90 97.83% | runtime.chansend C:\Program Files\Go\src\runtime\chan.go:259
2 2.17% | runtime.netpollblock C:\Program Files\Go\src\runtime\netpoll.go:526
92 98.92% 98.92% 92 98.92% | runtime.gopark C:\Program Files\Go\src\runtime\proc.go:363
----------------------------------------------------------+-------------
1 100% | runtime/pprof.runtime_goroutineProfileWithLabels C:\Program Files\Go\src\runtime\mprof.go:846
1 1.08% 100% 1 1.08% | runtime.goroutineProfileWithLabels C:\Program Files\Go\src\runtime\mprof.go:858
----------------------------------------------------------+-------------
... others ...
----------------------------------------------------------+-------------
0 0% 100% 90 96.77% | main.logHandler.func1 D:\proj\github.com\hzget\go-investigation\diagnostics\profile\main.go:29
90 100% | runtime.chansend1 C:\Program Files\Go\src\runtime\chan.go:145
----------------------------------------------------------+-------------
... others ...
----------------------------------------------------------+-------------
# visit http://localhost:6061/ui/source
# result:
main.logHandler.func1
D:\proj\github.com\hzget\go-investigation\diagnostics\profile\main.go
Total: 0 90 (flat, cum) 96.77%
24 . . ch <- http.StatusBadRequest
25 . . return
26 . . }
27 . . // simulation of a time consuming process like writing logs into db
28 . . time.Sleep(time.Duration(rand.Intn(400)) * time.Millisecond)
29 . 90 ch <- http.StatusOK // <------- 90 goroutines blocked here
30 . . }()
31 . .
32 . . select {
33 . . case status := <-ch:
34 . . w.WriteHeader(status)
To check the graph, visit http://localhost:6061/ui/
To check the frame graph, visit http://localhost:6061/ui/flamegraph
# another way:
# we can also get an interactive web interface directly
> go tool pprof -http localhost:6061 http://localhost:6060/debug/pprof/goroutine
Fetching profile over HTTP from http://localhost:6060/debug/pprof/goroutine
Saved profile in C:\Users\phz\pprof\pprof.goroutine.007.pb.gz
Serving web UI on http://localhost:6061
As we can see pprof shows that there’re 90 goroutine-leaks. To fix the issue, we can make the channel buffered:
 16 func logHandler(w http.ResponseWriter, r *http.Request) {
 17         ch := make(chan int, 1) // <----- buffered channel
 18         go func() {
 19                 obj := struct {
 20                         user string
 21                         age  int
 22                 }{}
 23                 if err := json.NewDecoder(r.Body).Decode(&obj); err != nil {
 24                         ch <- http.StatusBadRequest
 25                         return
 26                 }
 27                 // simulation of a time consuming process like writing logs into db
 28                 time.Sleep(time.Duration(rand.Intn(400)) * time.Millisecond)
 29                 ch <- http.StatusOK // <---- it will never block
 30         }()
 31
 32         select {
 33         case status := <-ch:
 34                 w.WriteHeader(status)
 35         case <-time.After(200 * time.Millisecond):
 36                 w.WriteHeader(http.StatusRequestTimeout)
 37         }
 38 }
Here’s the pprof analysis:
# simulate http load
> hey -d "{\"user\":\"Jack\", \"age\":17}" http://localhost:6060/log
...
...
Status code distribution:
[200] 111 responses
[408] 89 responses <------- 89 responses with "408 Request Timeout"
# generate goroutine profile
> curl -o goroutine_fixed.pb.gz http://localhost:6060/debug/pprof/goroutine
% Total % Received % Xferd Average Speed Time Time Time Current
Dload Upload Total Spent Left Speed
100 1290 100 1290 0 0 44293 0 --:--:-- --:--:-- --:--:-- 47777
# enter interactive mode
> go tool pprof main.exe goroutine_fixed.pb.gz
File: main.exe
Type: goroutine
Time: Mar 5, 2023 at 12:34am (CST)
Entering interactive mode (type "help" for commands, "o" for options)
(pprof) top
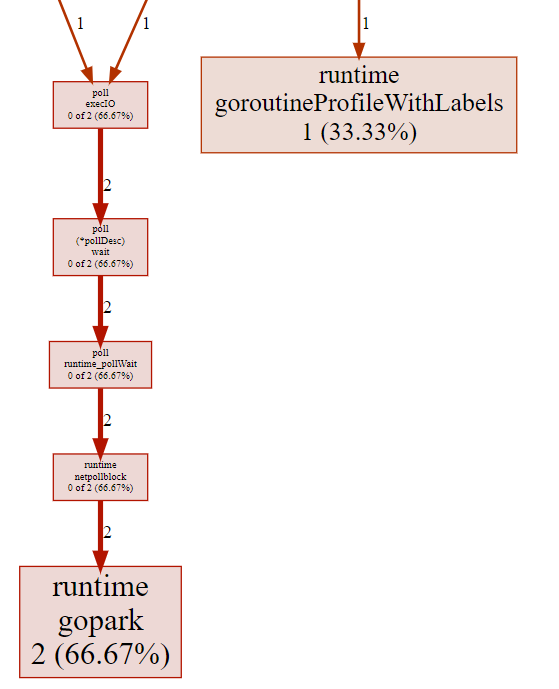
Showing nodes accounting for 3, 100% of 3 total <----- only 3 running goroutines
Showing top 10 nodes out of 30
flat flat% sum% cum cum%
2 66.67% 66.67% 2 66.67% runtime.gopark
1 33.33% 100% 1 33.33% runtime.goroutineProfileWithLabels
0 0% 100% 1 33.33% internal/poll.(*FD).Accept
0 0% 100% 1 33.33% internal/poll.(*FD).Read
0 0% 100% 1 33.33% internal/poll.(*FD).acceptOne
0 0% 100% 2 66.67% internal/poll.(*pollDesc).wait
0 0% 100% 2 66.67% internal/poll.execIO
0 0% 100% 2 66.67% internal/poll.runtime_pollWait
0 0% 100% 1 33.33% main.main
0 0% 100% 1 33.33% net.(*TCPListener).Accept
(pprof) q
# get an interactive web interface
>go tool pprof -http localhost:6061 goroutine_fixed.pb.gz
Serving web UI on http://localhost:6061
To check the graph, visit http://localhost:6061/ui/
To check the frame graph, visit http://localhost:6061/ui/flamegraph
check with grmon
Another way to check goroutine - grmon: Command line monitoring for goroutines.
# initial program
# before http load
> grmon -host localhost:6060
  # result:
  #    state               desc
  1    IO wait             internal/poll.runtime_pollWait(0x208d3ae0958, 0x72)
  24   running             runtime/pprof.writeGoroutineStacks({0x1344fa0, 0xc000528000})
  50   IO wait             internal/poll.runtime_pollWait(0x208d3ae0868, 0x72)

  total: 3                 last update: 15:07:10 CST

# after http load with hey
> hey -d "{\"user\":\"Jack\", \"age\":17}" http://localhost:6060/log
Status code distribution:
  [200] 111 responses
  [408] 89 responses

# grmon result:
# As we can see there're 89 extra goroutine blocked in "chan send".
  #    state               desc
  1    IO wait             internal/poll.runtime_pollWait(0x208d3ae0958, 0x72)
  24   running             runtime/pprof.writeGoroutineStacks({0x1344fa0, 0xc0000900e0})
  151  chan send           main.logHandler.func1()
  161  chan send           main.logHandler.func1()
  167  chan send           main.logHandler.func1()
  190  chan send           main.logHandler.func1()
  192  chan send           main.logHandler.func1()
  ...
  total: 92                last update: 15:10:29 CST

# fixed code
# after http load with hey
> hey -d "{\"user\":\"Jack\", \"age\":17}" http://localhost:6060/log
Status code distribution:
  [200] 108 responses
  [408] 92 responses

#
> grmon -host localhost:6060
# result:
  #    state               desc
  1    IO wait             internal/poll.runtime_pollWait(0x208f7580918, 0x72)
  463  IO wait             internal/poll.runtime_pollWait(0x208f7580828, 0x72)
  471  running             runtime/pprof.writeGoroutineStacks({0x3d4fa0, 0xc00032e1c0})

  total: 3                 last update: 15:23:10 CST